Method
In this page you will find information about the predictor implemented in PRODIGY. For information about the dataset used to train our predictor visit the PRODIGY dataset page.
Within PRODIGY our simple but robust descriptor of binding affinity is implemented which is based solely on structural properties of the protein-protein complexes (Vangone & Bonvin, eLife 2015). Using the protein-protein binding affinity benchmark of Kastritis et al. (2011) we showed that the number of interfacial contacts (ICs) of a protein-protein complex correlates with the experimental binding affinity. This information, combined with properties of the non-interacting surfaces (NIS), which have been shown to influence binding affinity (Kastritis at el. (2014)), has led to one of the best performing predictor so far which was also benchmarked on such a large and heterogeneous set of data.
Webinar
The predictor
The predictive model
In our recent work, we found a direct correlation between the number of interfacial contacts (ICs) in a protein-protein complex, and the binding strength. Our predictor is therefore based on a simple linear regression of ICs and some of the properties of the non-interacting surfaces (NIS), which have been shown to influence the binding affinity (check Kastritis at el. 2014).
ΔGpredicted = -0.09459 ICscharged/charged -0.10007 ICscharged/apolar +0.19577 ICspolar/polar -0.22671 ICspolar/apolar +0.18681 %NISapolar +0.3810 %NIScharged -15.9433
Equation 1. Predictive model implemented in PRODIGY.
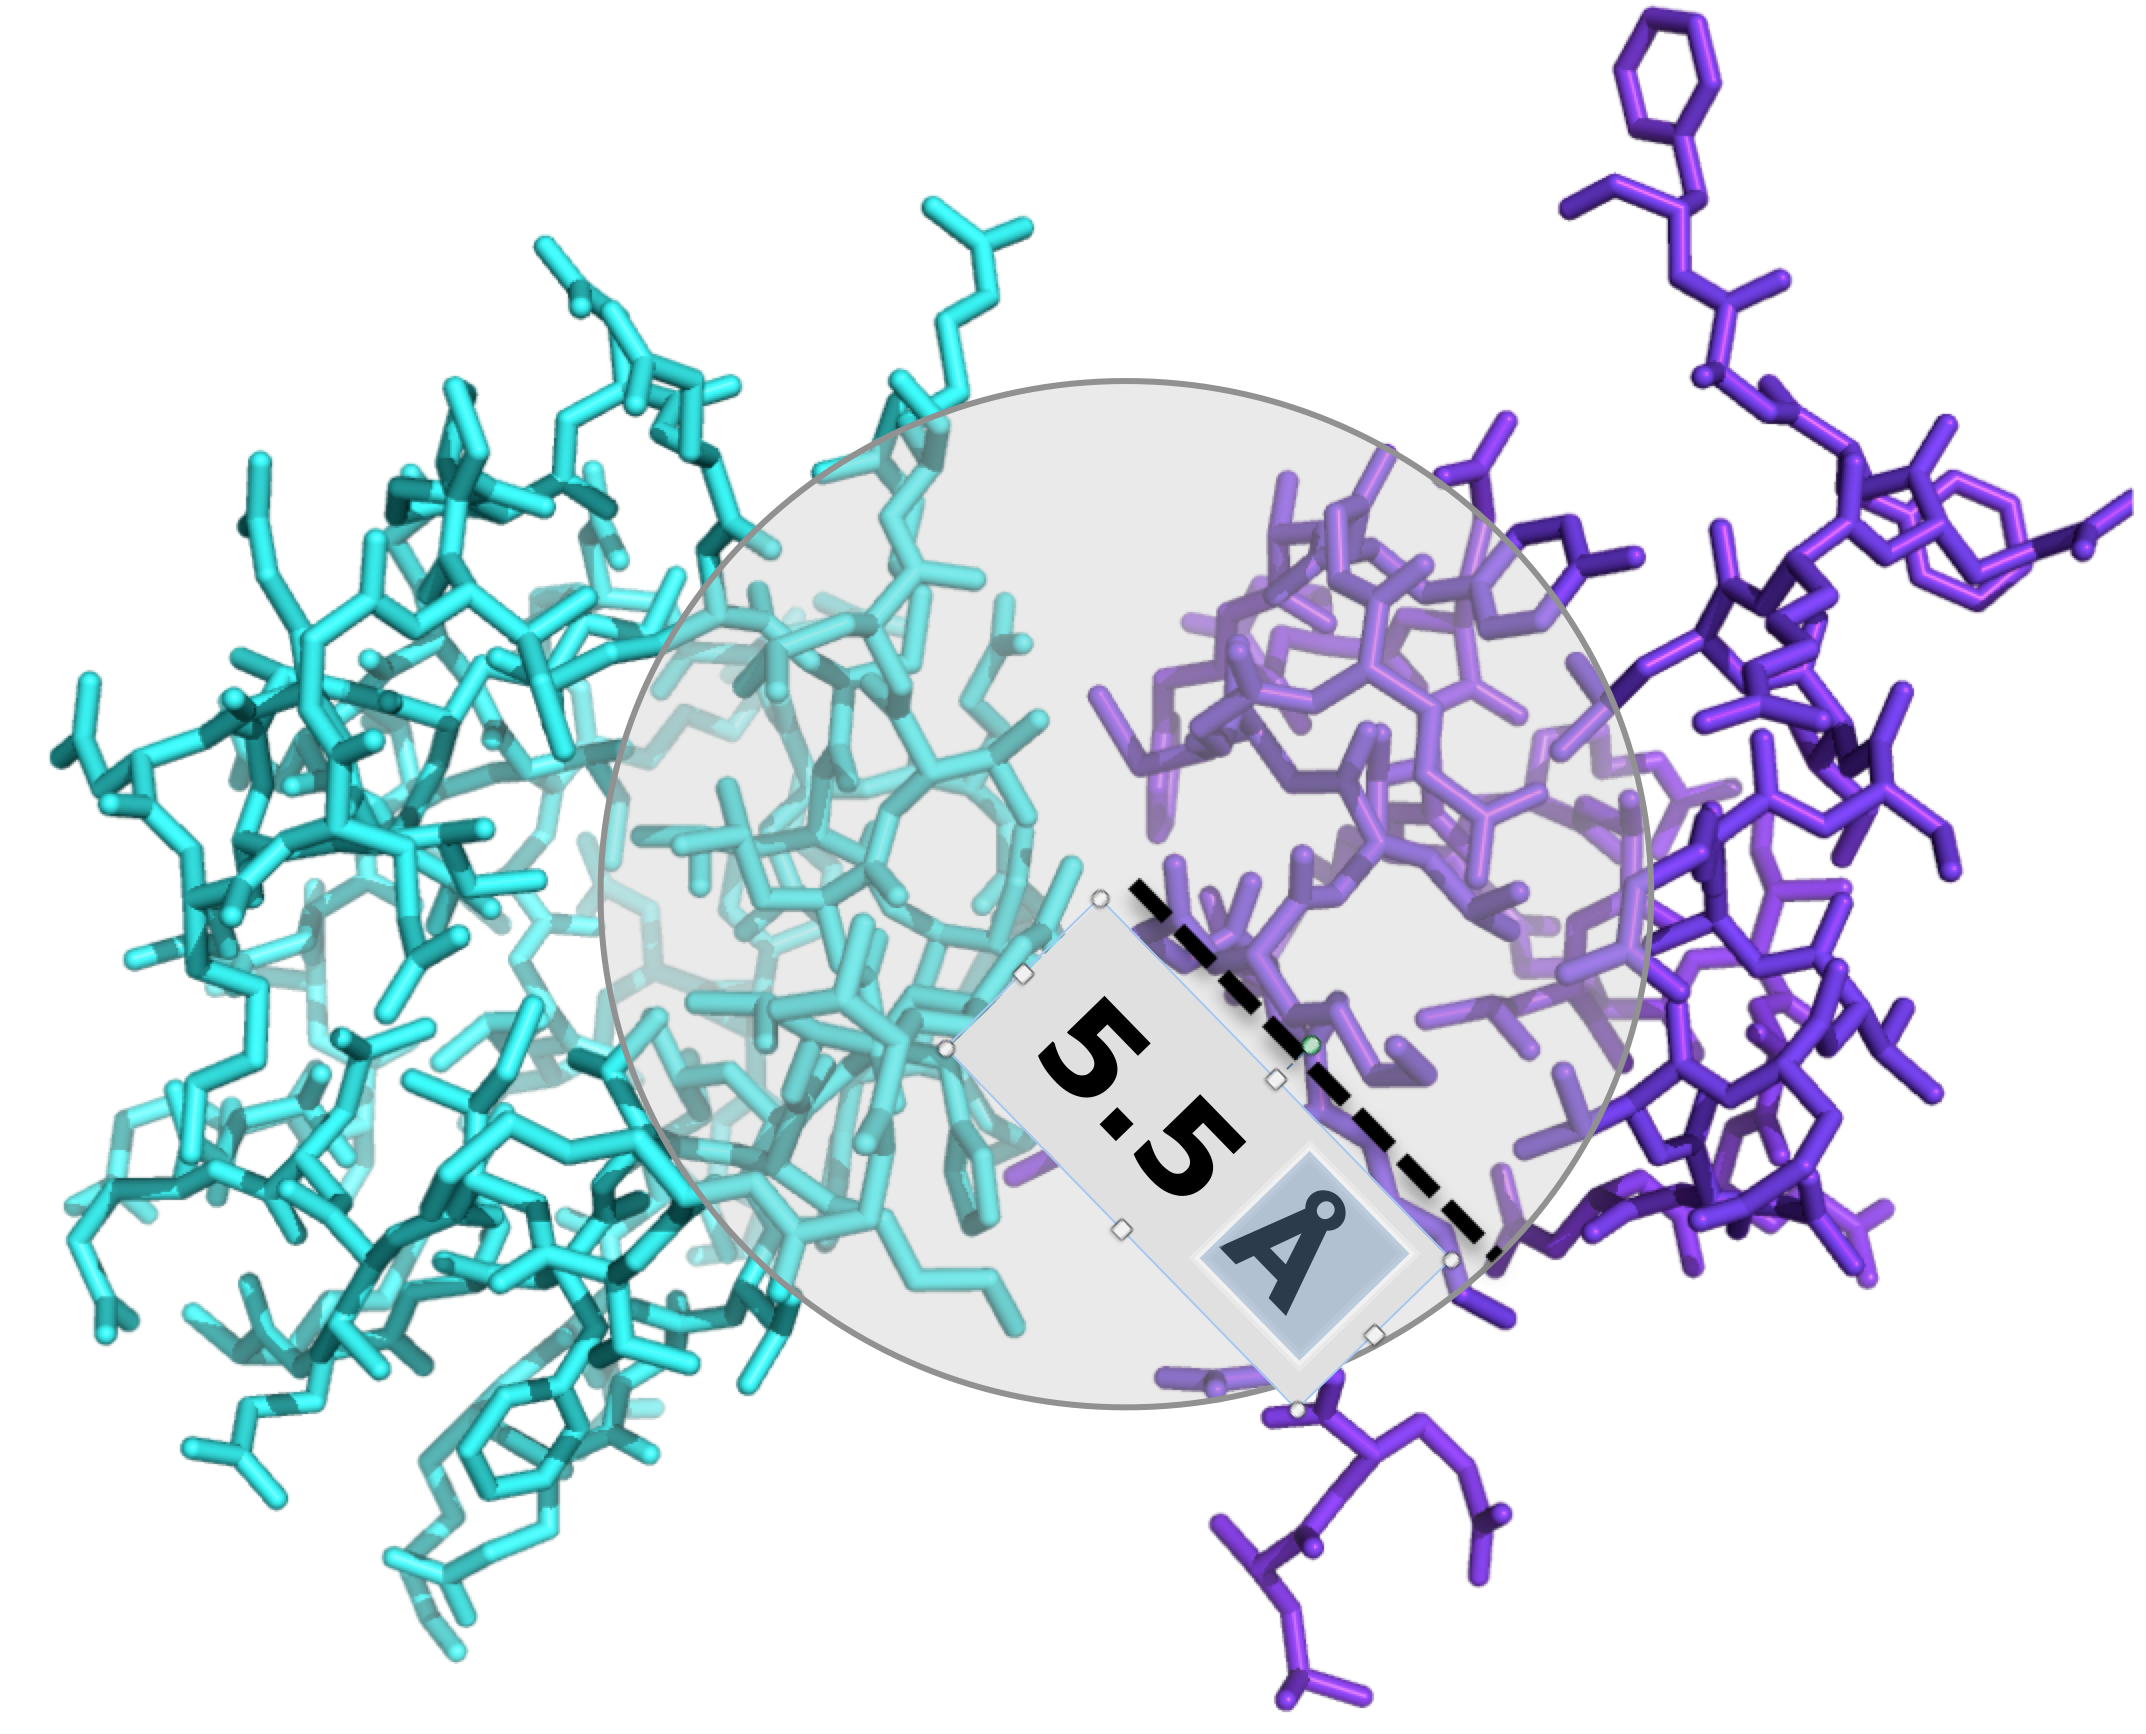
ICsxxx/yyy is the number of Interfacial Contacts found at the interface between Interactor1 and Interactor2 classified according to the polar/apolar/charged nature of the interacting residues (i.e. ICscharged/apolar is the number of ICs between charged and apolar residues). Two residues are defined in contact if any of their heavy atom is within a distance of 5.5 Å.
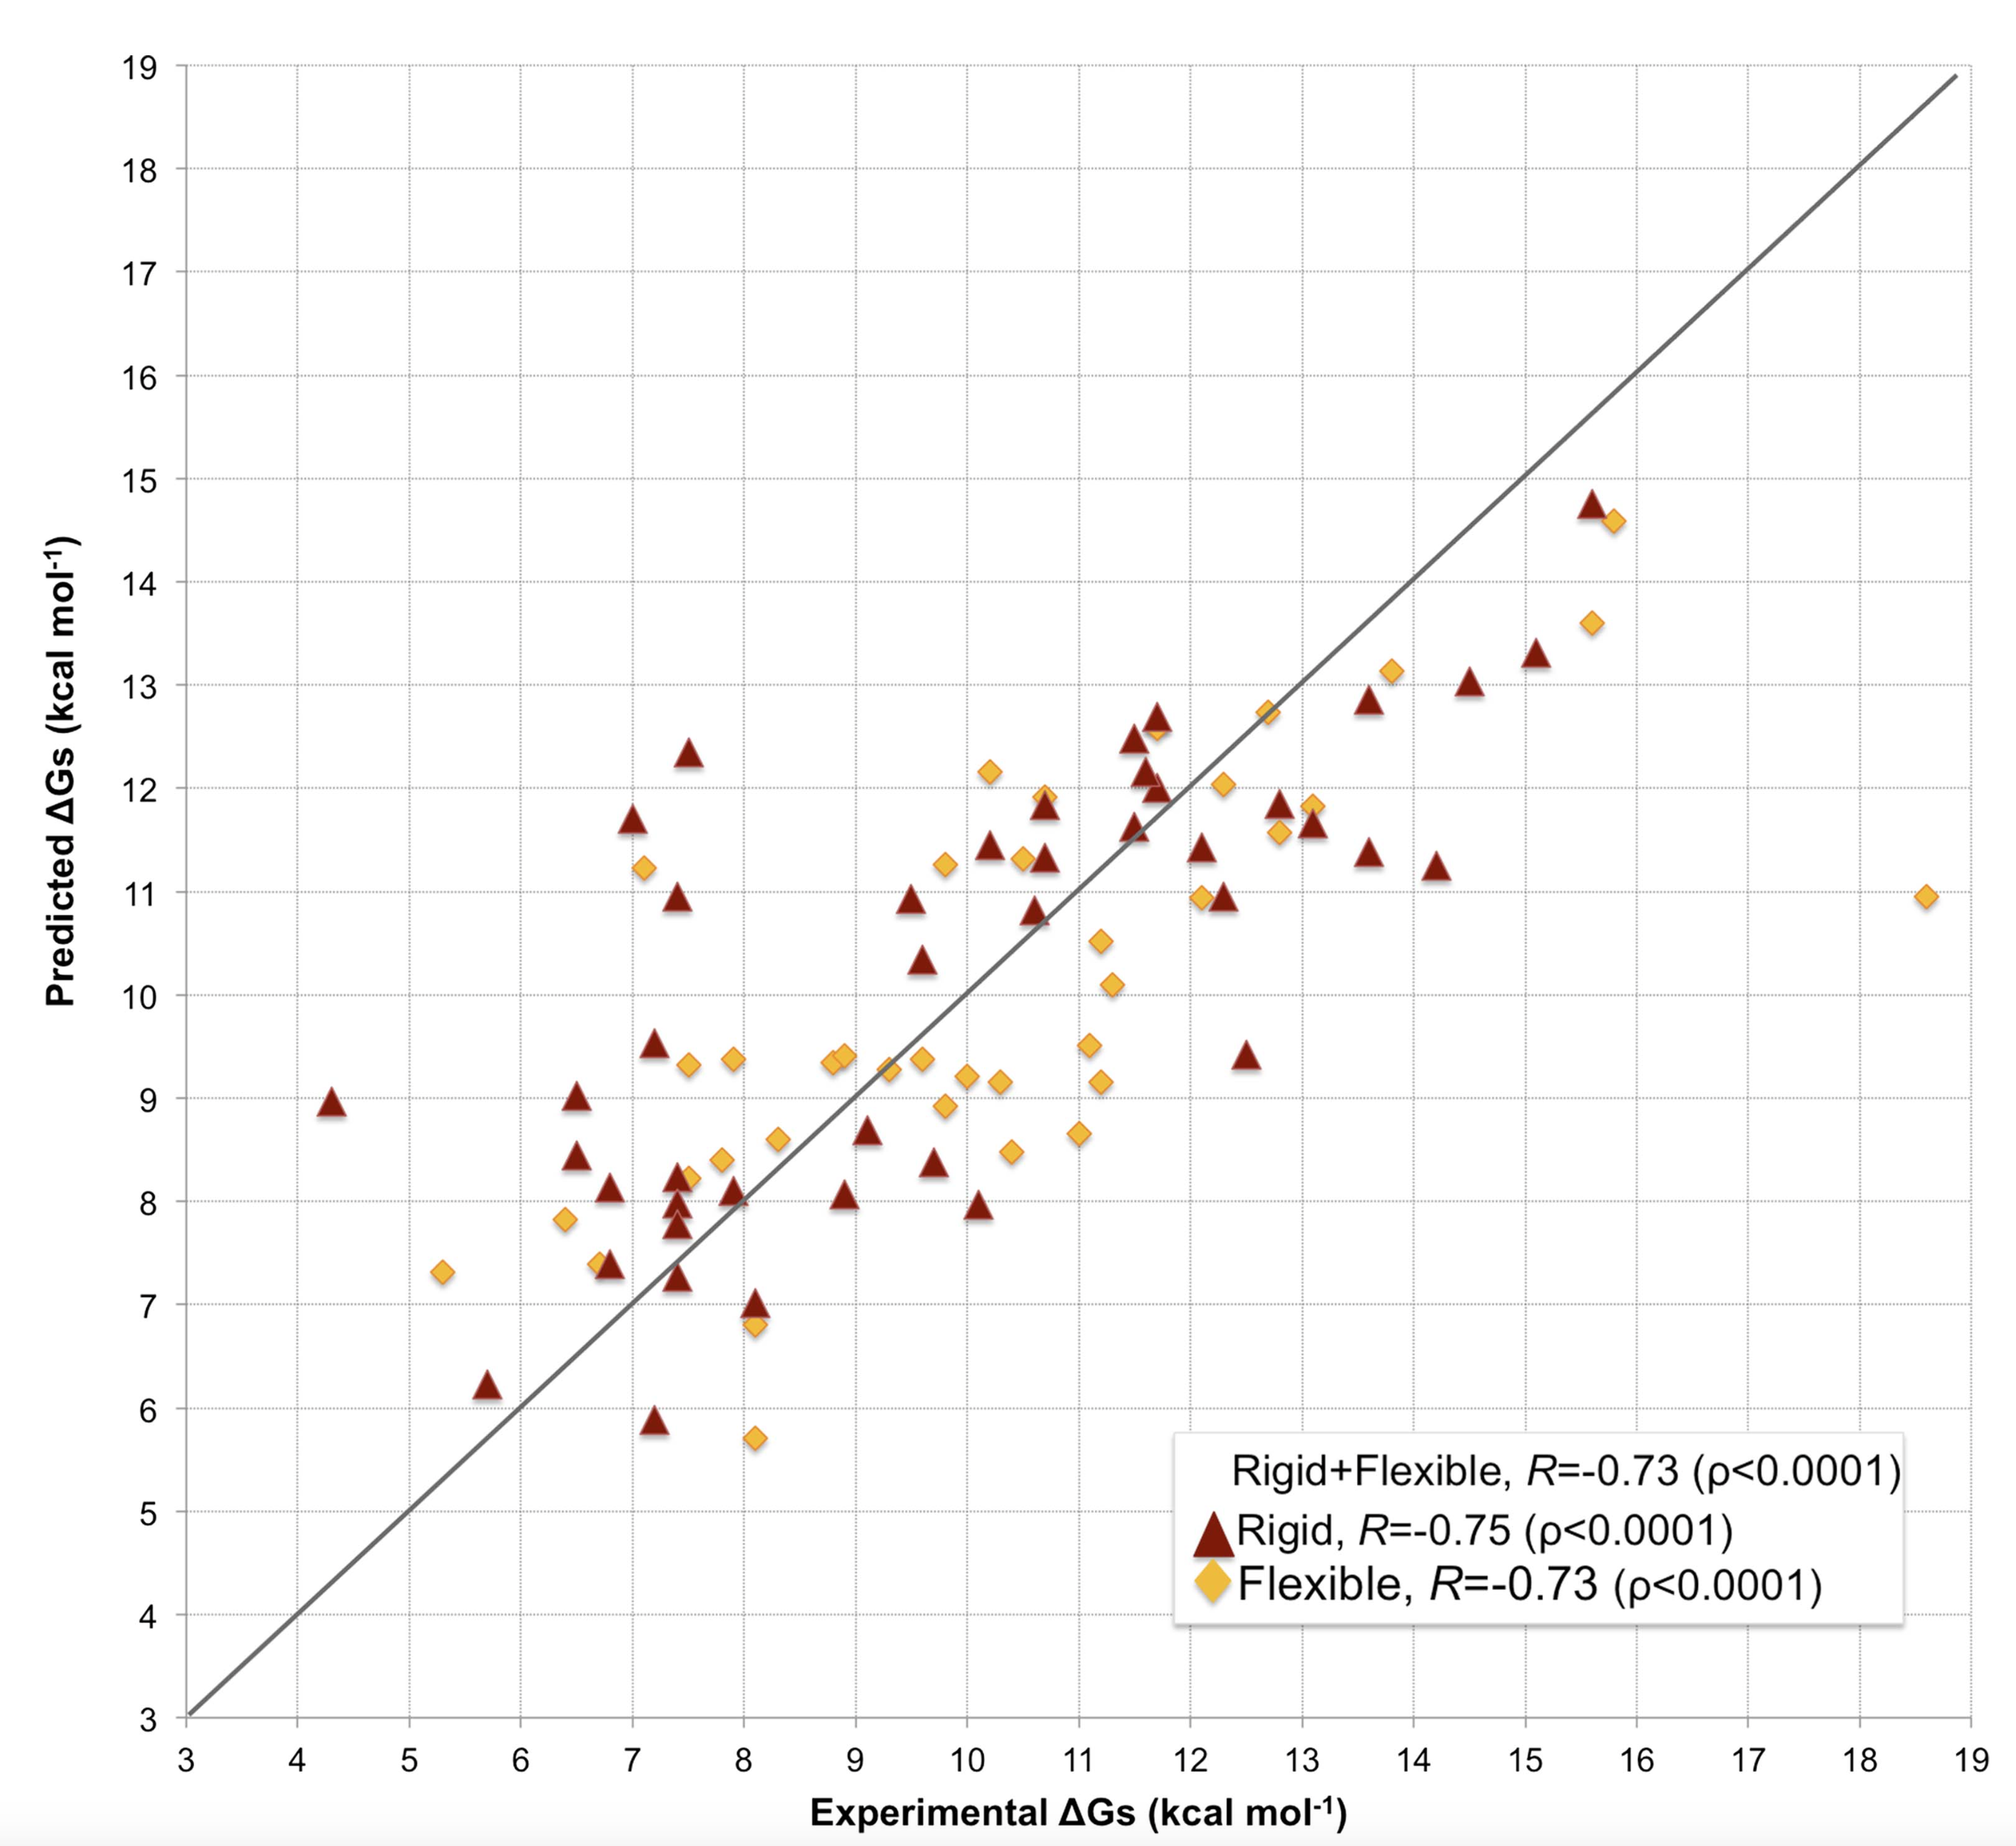
Our model predicts binding affinities with an unprecedented accuracy on such a large and heterogeneous dataset of complexes (81 in total) (see Figure 1), showing a Pearson’s Correlation of 0.73 (p-value < 0.0001) between the predicted and the experimental values and a RMSE (Root Mean Square Error) of 1.89 kcal mol-1.
Our results have been cross-validated through a 4-fold cross-validation approach. More information can be found online in Supplementary file 3 of Vangone & Bonvin, eLife (2015)
Based on the predicted binding affinity (ΔG) according to Equation 1, the dissociation constant (Kd) is calculated via the following formula:
ΔG = RT lnKd
where R is the ideal gas constant (in kcal K-1mol-1), T is the temperature (in K) and ΔG is the predicted free energy. By default the Temperature is set at 298,15 K (25.0 ℃), but can be modified by the user.
The effect of conformational changes on the prediction accuracy
In many assemblies, the structure of free monomers differs from their structure in the oligomeric state (the ‘bound’ form) due to the association process. The affinity benchmark also reported the interface RMSD (i_rmsd) between the unbound and bound structures. This is a measure of how much conformational change takes place upon association. We investigated if our model had a higher predictive power when classifying the complexes according to their amplitude of conformational change upon binding (see Figure 1). Predictions made with our model are less effected by conformational changes than all previous models (see Figure 2), with only minor differences in performance between rigid (i_RMSD ≤ 1.0 Å, r= 0.75 and RMSE = 1.88 kcal mol-1) and flexible cases (i_RMSD > 1.0 Å, r= 0.73 and RMSE = 1.89 kcal mol-1). This indicates that, in contrast to previous predictors, the number of interface residue contacts is a rather robust predictor hardly influenced by conformational changes.
The performance
Our predictor shows a Pearson’s Correlation r of 0.73 (p-value < 0.0001) between the predicted and the experimental values and a RMSE (Root Mean Square Error) of 1.89 kcal mol-1.
In order to perform a fair comparison with other previously published methods, we calculated their performance on the complexes that are in common between our clean dataset, the one reported by Moal et al. (2011), and the pre-calculated data on the Computational Characterisation of Protein–Protein Interactions (CCHarPPI) web-server, ending up in 79 protein–protein complexes (Figure 2). The considered models include the ‘global surface model’ of Kastritis et al. (2014), the BSA-based (Buried Surface Area) model of Horton and Lewis (1992) , the top three best performing methods reported by Moal et al. (2011) and the composite scoring functions reported by the CCHarPPI webserver. As shown in Figure 2, our model outperformed all other methods tested. It is also less sensitive to conformational changes.
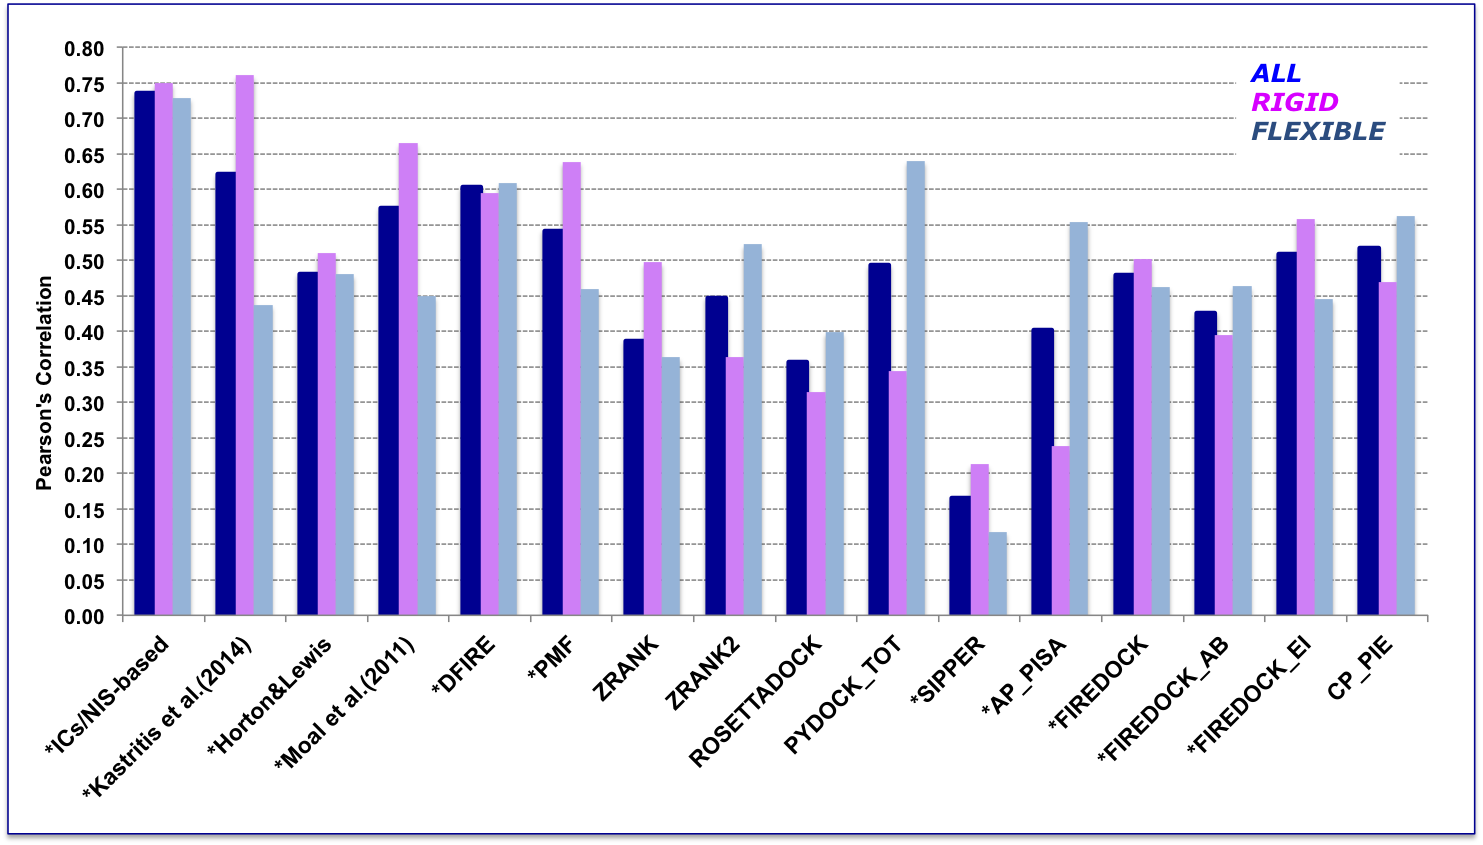
All associated data can be found online as Supplementary file 4 in Vangone & Bonvin, eLife (2015) . In addition to the composite scoring function of CCharPPI, none of the other 99 intermolecular parameters reported by CCharPPI outperformed our model.
Number of Contacts at the Interface (ICs)
We counted the number of contacts at the interface (ICs) for each protein-protein complex in the benchmark and
we correlated ICs with the binding strength of the complex. Two residues were considered in contact if a pair of
(any) atoms belonging to the two residues is within a defined cut-off distance. After systematic sampling of
the threshold, we fix it at 5.5 Å (see Figure 3).
Further, residues were classified based on their physico-chemical properties as follows:
polar: C, H, N, Q, S, T, W
apolar: A, F, G, I, L, V, M, P, Y
charged: E, D, K, R
Within our model we also used some of the NIS (Non Interacting Surface) properties. Details about it are reported in Kastritis at el. (2014).
PRODIGY-LIG is an extension of our software PRODIGY (PROtein binDIng enerGY prediction), aimed at the prediction of affinity in experimental/modelled protein-small ligand complexes (if you have a protein-protein complex, please refer to the PRODIGY section).
Our approach relies on simple structural and energetic properties of the complex, and it is therefore suitable for every type of complex.
Training of PRODIGY-LIG
For Stage2 of the D3R challenge we designed an adapted version of our contact-based prediction for protein-ligand complexes (PRODIGY). From the 2P2I database, we retrieved 200 protein-ligand complexes with experimentally measured Ki (inhibition constant) and available crystal structure. For each entry, we ran the HADDOCK refinement protocol in order to collect the intermolecular energy terms. This consists of the final refinement stage of HADDOCK without any initial perturbation of the starting structures. We then calculated the number of atomic contacts (ACs) within the distance threshold of 10.5Å (this cutoff was optimized in order to obtain the best correlation). We further classified the ACs according to the atom involved in the interaction (C=Carbon, O=Oxygen, N=Nitrogen, X=all other atoms). We used this combination of structural- and energy-based terms to train a multiple linear regression model with R, performing 4-fold cross validation. We applied Akaike's Information Criterion (AIC) stepwise selection method implemented in R to avoid overfitting and identify the significant features. The resulting binding affinity predictor models ΔGscore and ΔGpredicted for ranking ligands and predicting the affinity, respectively, is shown in the equation:
ΔGscore = 0.343794 Eelec - 0.037597 ACCC + 0.138738 ACNN + 0.160043 ACOO - 3.088861 ACXX + 187.011384
ΔGpredicted = 0.0115148 Eelec - 0.0014852 ACCC + 0.0057097 ACNN - 0.1301806 ACXX -5.1002233
where ACCC, ACNN, ACOO, and ACXX are the ACs between Carbon-Carbon, Nitrogen-Nitrogen, Oxygen-Oxygen and between all other atoms and polar hydrogens, respectively. Eelec is the electrostatic energy calculated through the HADDOCK refinement protocol. For each of the top 10 it1 poses from the docking runs we calculated the Gscore and took the average. We finally ranked the ligands according to the predicted values of our averaged ranking-score.
The "No electrostatics protocol": prediction when the electrostatic energy is not provided
Similarly to the previously-described procedure, we trained another prediction model based only on the number of atomic contacts (ACs) within the distance threshold of 10.5Å and classified the ACs according to the atom involved in the interaction (C=Carbon, O=Oxygen, N=Nitrogen, X=all other atoms). We trained a multiple linear regression model with R, performing 4-fold cross validation:
ΔGnoelec = 0.0354707 ACNN -0.1277895 ACXX - 0.0072166 ACCN - 5.1923181
Testing of PRODIGY-LIG
PRODIGY-LIG, properly readapted to address systems with small ligands, has been successfully applied for the blind prediction of 102 protein-ligand complexes during the D3R Grand Challenge 2.
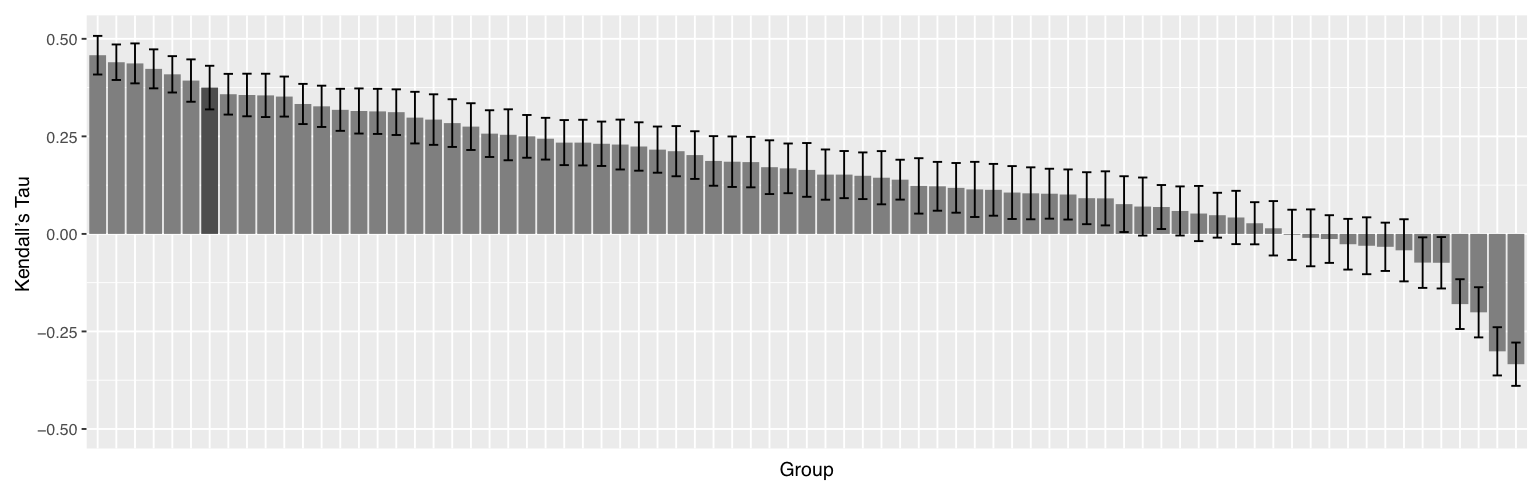
Our predictor was then successfully used to predict the binding affinity of 102 protein-ligand targets proposed during the blind D3R Grand Challenge 2 - Stage 2. PRODIGY-LIG reached a correlation score (Kendall's Tau) of 0.37, placing our approach as the 8th best predictor presented over 88 in total (see also Kurkcuoglu et al,. 2018). However, with different usage of the data made available from the challenge, our approach would have reached a correlation score of 0.43 and 3rd in ranking, as reported by the organizers of the Challenge (see page 10 in Gaieb et al., 2018)
Further details: The correlation scores (Kendall's Tau) of the binding affinity rankings calculated for D3R Grand Challenge 2 - Stages 2 for all groups are summarized in the following figure.
We noticed that averaging the Gscore over the top 10 models resulted in a correlation of 0.37 while using only the top scoring model yielded 0.28. Considering that our top 10 poses are rather heterogeneous in their conformations, our binding affinity predictor seems rather robust and not too sensitive to the exact conformation of the ligand.
We also investigated the potential of our ranking predictor for identification of lead compounds. We defined as true positive the targets which are within the top N ranked compounds of both the predicted and experimental binding affinity rankings (N: 1,2…,102). Then, we calculated the positive predictive value (PPV), which is equal to the number of true positives divided by the number of predicted positives (top N ranked targets according to BA predictor). We plotted PPV as a function of N together with the diagonal which represents a random prediction (RP).
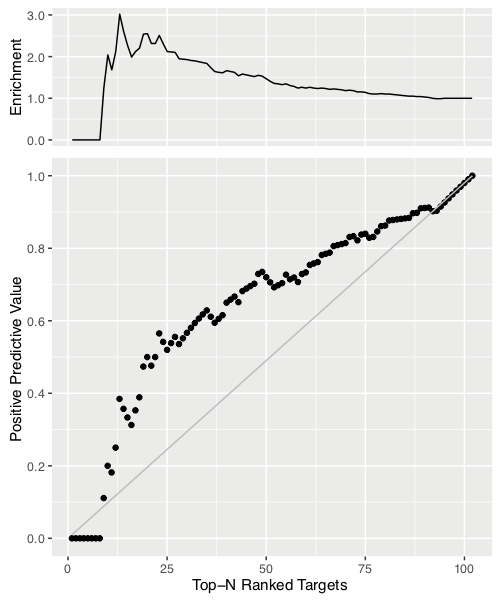
We also report the enrichment factor (PPV/RP) on the top of the figure. This analysis indicates that our predictor reaches a 2.5-fold improvement in correct identification of effective ligands in the top 20-25% compared to random.
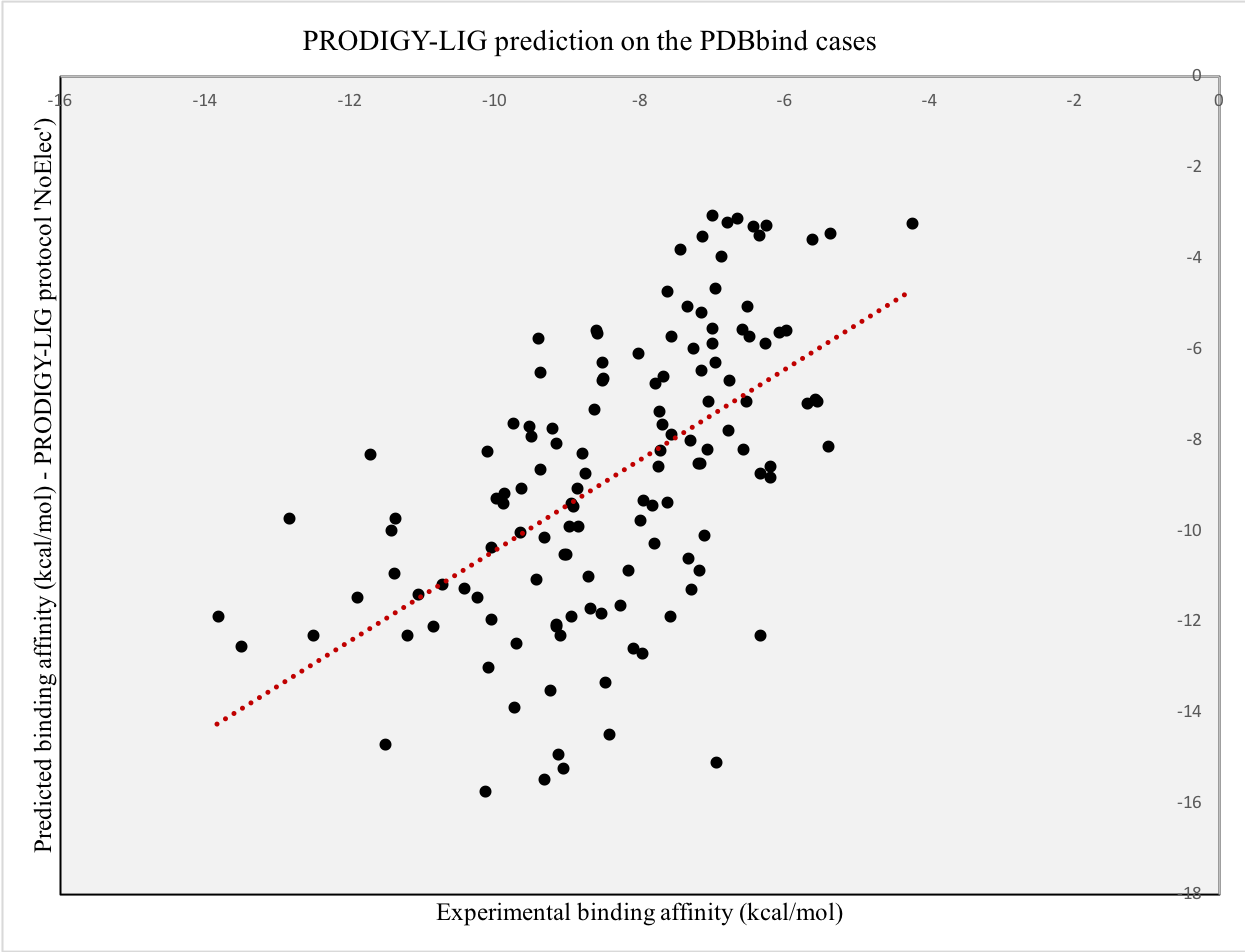
Testing of PRODIGY-LIG on the PDBbind dataset
In order to further test our predictor on another independent set, we selected 124 cases from the PDBbind dataset available online. Precisely, we extracted 124 PDB entries from the core_set_v.2013 for which the Ki values had been experimentally measured. For each entry, we ran the HADDOCK refinement protocol in order to collect the intermolecular energy terms and provided the top 10 structures as input to PRODIGY-LIG.
We obtained a Pearson’s Correlation coefficient of 0.57 between the experimental and predicted values when applying the “no electrostatic” protocol (see plot below, p-value < 0.0001 and Root Mean Square Error of 2.62 kcal/mol), of 0.43 when applying the full-features one and 0.42 then comparing the predicted and experimental ranking,
PRODIGY-CRYSTAL is an extension of our software PRODIGY (PROtein binDIng enerGY prediction) and PRODIGY-LIG (PROtein binDIng enerGY prediction – LIGang protocol), aimed at the classification of protein interfaces in crystallographic or biological.
Please Notice! If you are sure about the nature of your interface and wish to predict the binding affinity, please visit the
PRODIGY page for protein-protein complexes and the
PRODIGY-LIG page for protein-ligand ones.
Given the importance of distinguishing a biologically-relevant interface from a crystallographic one when complementary experimental information is missing, we provide here new insights into the structural – focusing on the intermolecular residue contacts - and energetics differences between those interfaces, and present a novel approach to accurately classify them.
Our approach relies on simple structural and energetics properties on the complex, and it is therefore suitable for every type of complex.
The PRODIGY-CRYSTAL prediction
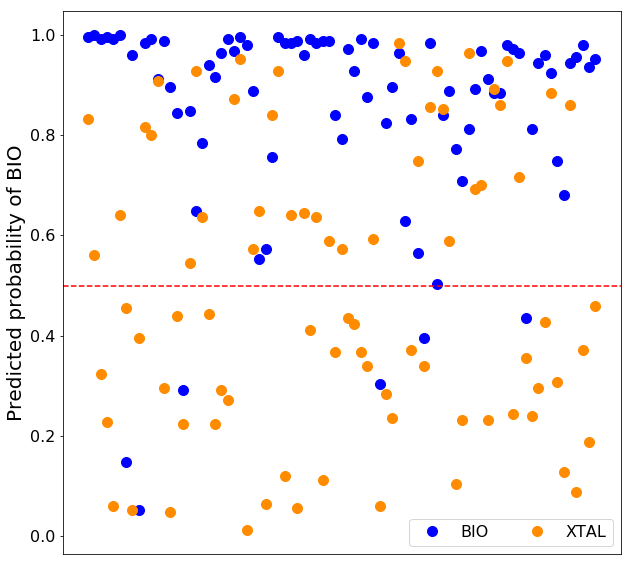
PRODIGY-CRYSTAL was trained on the Many dataset, compiled by Baskaran et al. (2014) and containing about 3000 biological (bio) and 3000 crystallographic (xtal) interfaces. Our final predictor is based on a Random Forest approach, where only structural features of the interface are used for classification (see paragraph below).
Besides the classification of the query interface in biological or crystallographic, we provide the probabilities, a number between 0 and 1 which indicate how likely the sample is to belong to the predicted class according to the model. Each decision tree outputs the probabilities of the classes as the fraction of samples of the same class in a leaf. The probability of the prediction is then calculated as the mean of probabilities of the predicted class across all the trees in the random forest. It can be interpreted as a measure of certainty of the model.
Description of the structural features in PRODIGY-CRYSTAL
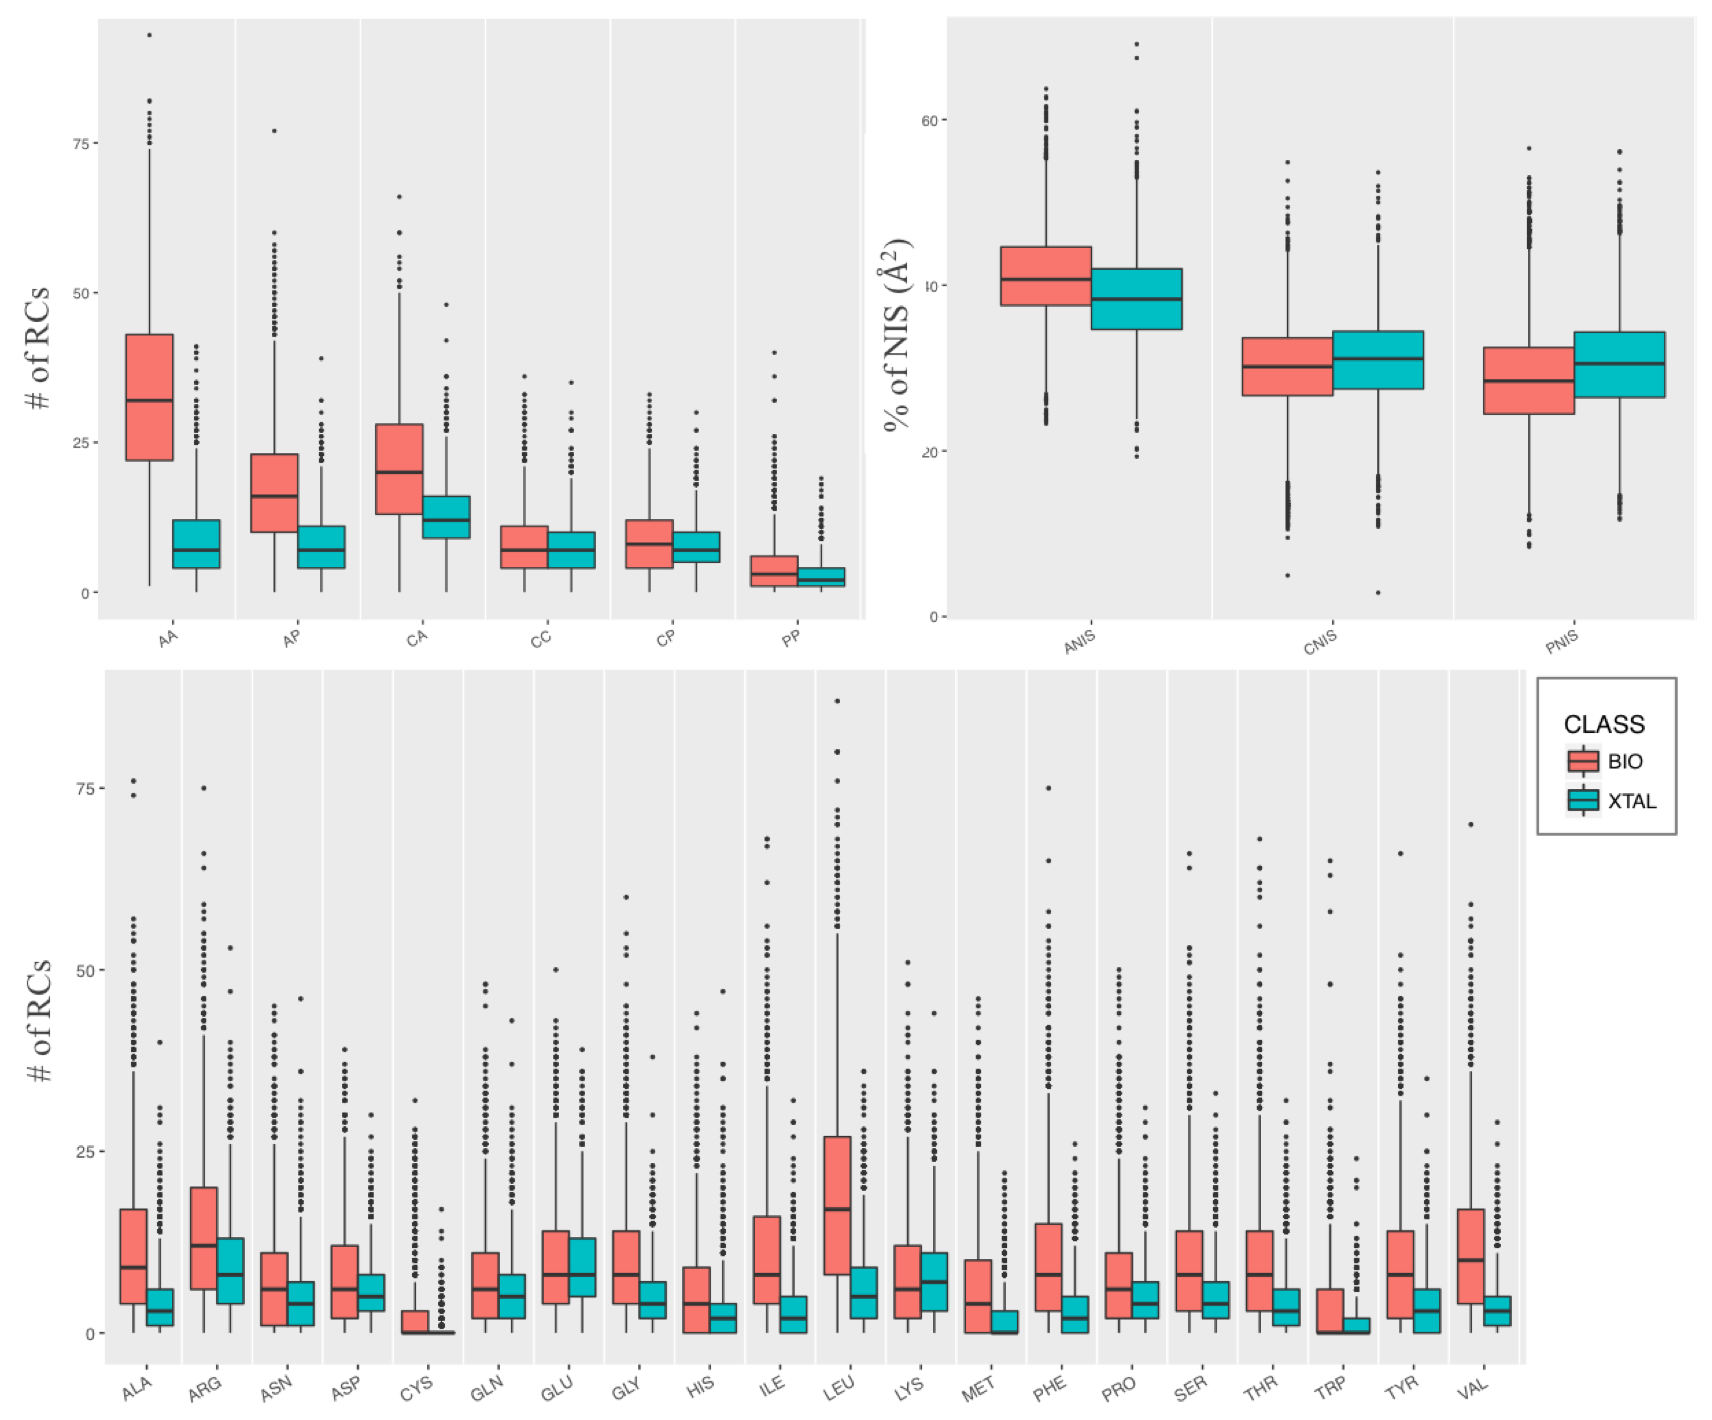
PRODIGY-CRYSTAL is based on several structural and energetic features. The ones which resulted the most different between bio/xtal and on which our machine learning classificatory is based, are:
- Pair-wise Residue Contacts (RCs). Two residues were considered in contact if any atom pair of the two residues is closer than a defined cut-off distance of 5.0 Å. RCs were further classified by the types of the residues in contact, charged-charged (CC), charged-polar (CP), charged-apolar (CA), polar-polar (PP), polar-apolar (PA) and apolar-apolar (AA), as reported in the PRODIGY Method page.
- RCs per amino acid. For each of the 20 standard amino acids, the number of RCs in which the amino acid is involved was calculated.
- Link Density (LD), that expresses the density of the interfacial network. This is calculated as the total number of RCs at the interface divided by the maximum possible number of pair-wise contacts for that interface, as:
LD = RCs/(Res1*Res2)
where Res1 and Res2 are the number of residues involved in RCs for interface 1 and 2, respectively.
Features importance
During the training phase of our model, we have applied a feature selection protocol which ranked the features according to the relative importance in the classifier:
| AA | 0.270 |
| LEU | 0.096 |
| VAL | 0.079 |
| AP | 0.065 |
| LD | 0.057 |
| ILE | 0.051 |
| PHE | 0.043 |
| CA | 0.042 |
| TYR | 0.035 |
| ALA | 0.022 |
| THR | 0.022 |
| HIS | 0.021 |
| MET | 0.016 |
| ASP | 0.016 |
| ARG | 0.015 |
| PRO | 0.015 |
| GLY | 0.015 |
| CP | 0.015 |
| CYS | 0.015 |
| SER | 0.014 |
| GLU | 0.014 |
| GLN | 0.011 |
The features reported in this table are the interfacial residue-contacts classified according to the amino acid involved (with a total of 20 RCs-classes, one for each standard amino acid, reported as single-code in the table) and their polar/apolar/charged character, with a total of 6 classes: charged-charged (CC), charged-polar (CP), charged-apolar (CA), polar-polar (PP), polar- apolar (PA) and apolar-apolar (AA) contacts.
A Random Forest of 500 trees was used to analyze the feature importance and perform recursive feature elimination with cross-validation in scikit-learn. First, the estimator is trained on the initial set of features and the importance of each feature is obtained through a feature importance attribute. Then, the least important features are pruned from the current set. The procedure is recursively repeated on the pruned set until there is no increase in the accuracy. The feature importance is measured by the decrease of Gini impurity index when splitting on a feature, averaged over all trees.
Performance of PRODIGY-CRYSTAL
Performance on the Many dataset
Our final pair-wise contact-based model was trained over the set of features described above (RCs divided by type/physico-chemical characteristics and Link Density), based on a Random Forest approach. On the Many dataset, we correctly predict 91% and 93% of the biological and crystallographic interfaces, respectively, while we misinterpret about 7% of the xtal cases as bio, and 9% of the bio cases as xtal (average over the 10 test sets from the 10 fold training on the Many entries).
We compared our results with the performance reported for the state of the art methods EPPIC and PISA. They have shown the same recall on a PDB-wide scale of 88% of PDB-interfaces (Baskaran et al. 2014). Comparing our performance on the Many dataset, we reached a prediction accuracy of 92% versus the 88% of EPPIC and 83% of PISA (4615 interfaces correctly predicted over a total of 5568).
Details of PRODIGY-CRYSTAL performance on the Many dataset can be found in our publication Elez, Bonvin and Vangone. BMC Bioinformatics 2018. Details of EPPIC on the Many can be found in Baskaran et al. BMC Struct Biol 2014. To evaluate PISA performance on the Many, pre-calculated XML description of macromolecular assemblies was downloaded for each PDB entry of the Many dataset. The files were parsed and the predictions were extracted following the same approach described in Baskaran et al.” When no assemblies were returned by PISA (predicted monomer) then all interfaces belonging to that PDB entry were marked as crystallographic. The assemblies were labeled as stable, unstable or falling in the gray-region of complex formation and all the unstable assemblies were removed from the list. If all the remaining labels were "gray-region" we considered all interfaces in that entry as lacking a prediction. Otherwise, the interfaces from the largest stable assembly were categorized as biological and all other interfaces were tagged crystallographic”. With such approach, PISA produced a prediction for 97% of the interfaces in the Many dataset and its final accuracy was 83%.
Performance on the DC dataset
On the smaller DC dataset (about 160 cases vs the 5735 of the Many), our accuracy is lower with 74%, against 81% for EPPIC and 79% for PISA. However, the performance of EPPIC on the DC dataset has only been calculated for entries for which enough evolutionary information was found (about 82% of the DC entries). In fact, being an evolutionary-based method, its principal limitation is the sequence alignment depth.